
Annual World Cocoa Prices 2016–2024
1. Annual Averages of International Cocoa Prices (ICCO, in USD per metric tonne):
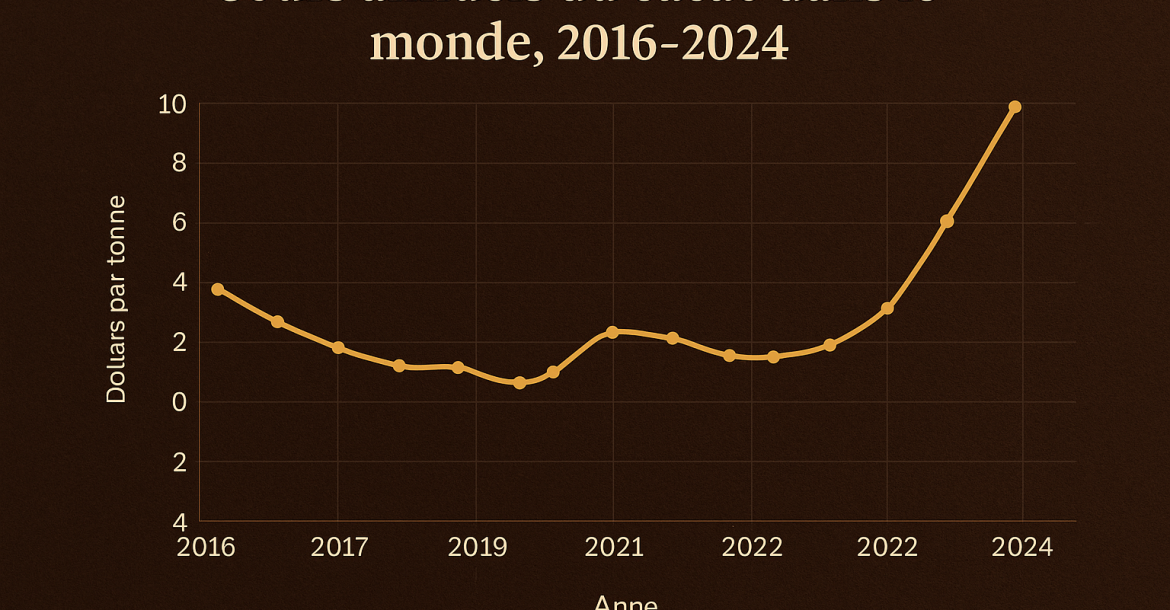
1. Annual Average International Cocoa Prices (ICCO, in USD per metric tonne):
These figures represent the average of daily prices over the whole calendar year. They give a clear view of the major trends and of volatility.
| Year | Average Annual Price (USD/tonne) | General Trend Compared with Year N-1 |
|---|---|---|
| 2016 | 2862 | Decline (after a 2015 peak) |
| 2017 | 2006 | Sharp decline |
| 2018 | 2320 | Recovery |
| 2019 | 2331 | Stable/Slight rise |
| 2020 | 2422 | Rise |
| 2021 | 2504 | Moderate rise |
| 2022 | 2447 | Slight decline |
| 2023 | 3213 | Sharp rise |
| 2024 | >6000 (volatile estimated average)* | Historic price surge |
*Note for 2024: The cocoa price experienced extreme volatility and increases in 2024, reaching record highs well above USD 10,000/tonne at times. The annual average will therefore be exceptionally high but will also reflect sharp fluctuations. As of the end of May 2025, prices have come down from those peaks but remain historically high compared with the pre-2023 period. A precise annual average for 2024 will require consolidating all the year's daily prices.